
Learn daily, act timely
When continuous audience insights are introduced in radio, professionals commonly overreact to what Fred Jacobs calls “EKG-like lines that dip for commercials, new music, and DJ talk”. As I acknowledged in my previous article, rushed decisions are a human temptation both on PPM (or similar) and data-analysis based techniques. It would not be different for our solution, Voizzup, if it was JUST a tool for content evaluation.
In order to prevent overreaction, Voizzup introduces a framework for continuous improvement, which includes technology, methodology and mindset based on constant listener feedback, short learning cycles and experimentation.
Solid, contrasted conclusions can be turned into action over (a short) time, after running experiments for validating or refuting assumptions. This is the opposite to rushed decisions driven by fear. (For more on Voizzup framework for continuous improvement for radio, please, read this article).
It’s important neutralising that natural tendency in radio professionals to rush or overreact to content evaluation. However, we should not underestimate the value of those EKG-like lines, following Jacob’s analogy, for daily learning.
Let’s see some curves from the daily view on Voizzup dashboard:

In the graph above we see the distribution of listeners of a morning show minute by minute on a random day, from 6 to 9 in the morning, you can also see the changes in volume (positive net in green, negative net in red).
From day to day, the curve can be similar… Or not at all. Ripples are different every day. Green and red bars (volume changes) vary from day to day, as well. Each day has its own correlations between reach increases or drops, volume changes, and most importantly, on-air content.
Overreacting is not a good idea, correct. Not learning from listening behaviours every single day, with this amount of information available, would not be very wise either.
How could you ignore this information about minute per minute tune-outs?
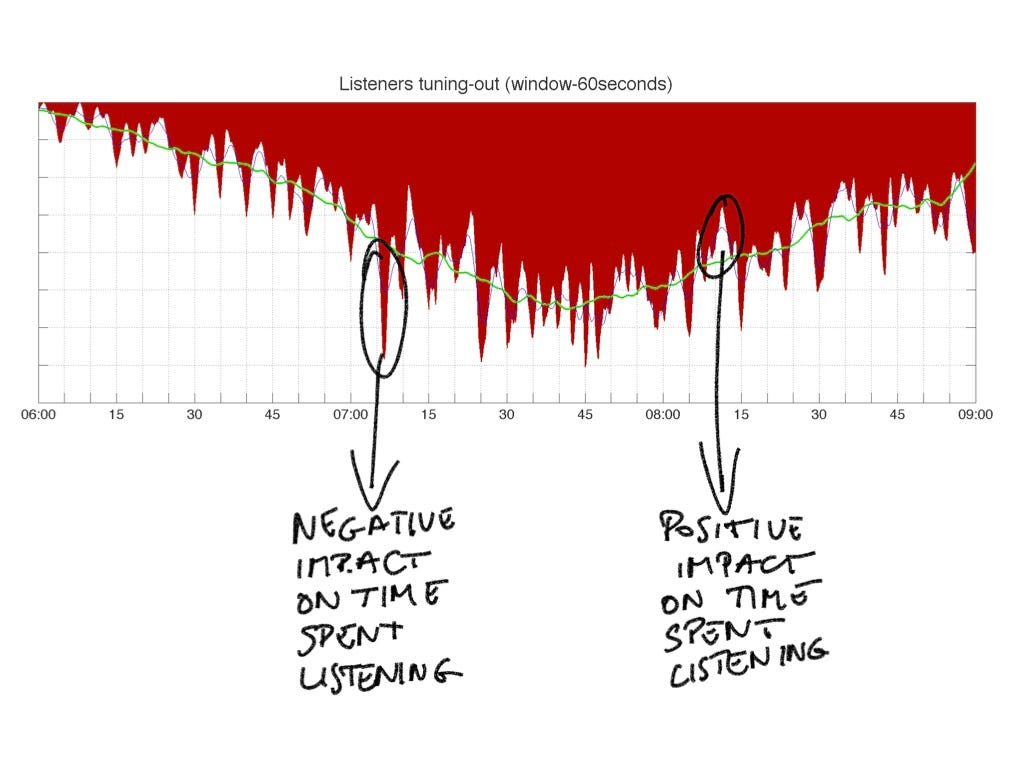
In this graph you can find out whether each piece of content during the show had a positive or negative impact on Time Spent Listening by measuring tune-outs per minute and comparing them with an average reference curve.
Recently, the host of one of the shows we work with confirmed that a new segment performed consistently great during the first two weeks on-air and, therefore, he decided to keep it in the programme. The segment made listeners tune-out less (and therefore stay listening longer) and show passion every single day.
Our recommendation: Don’t feel rushed to turn your learnings from today into changes in the show tomorrow. Learn daily, act timely. Observe, make notes, find patterns, make assumptions, understand why’s and then act.