A few years ago, a video from visionary David Bowie went viral. In an interview on BBC, from 1999, Bowie predicted the impact of Internet. The perplexed interviewer, Jeremy Paxman, asked “It’s just a tool, isn’t it?”. Bowie replied “No, it’s not. It’s an alien life form” and laughed. I believe both of them were right.
The usage of tools is defining for human kind. Literally.
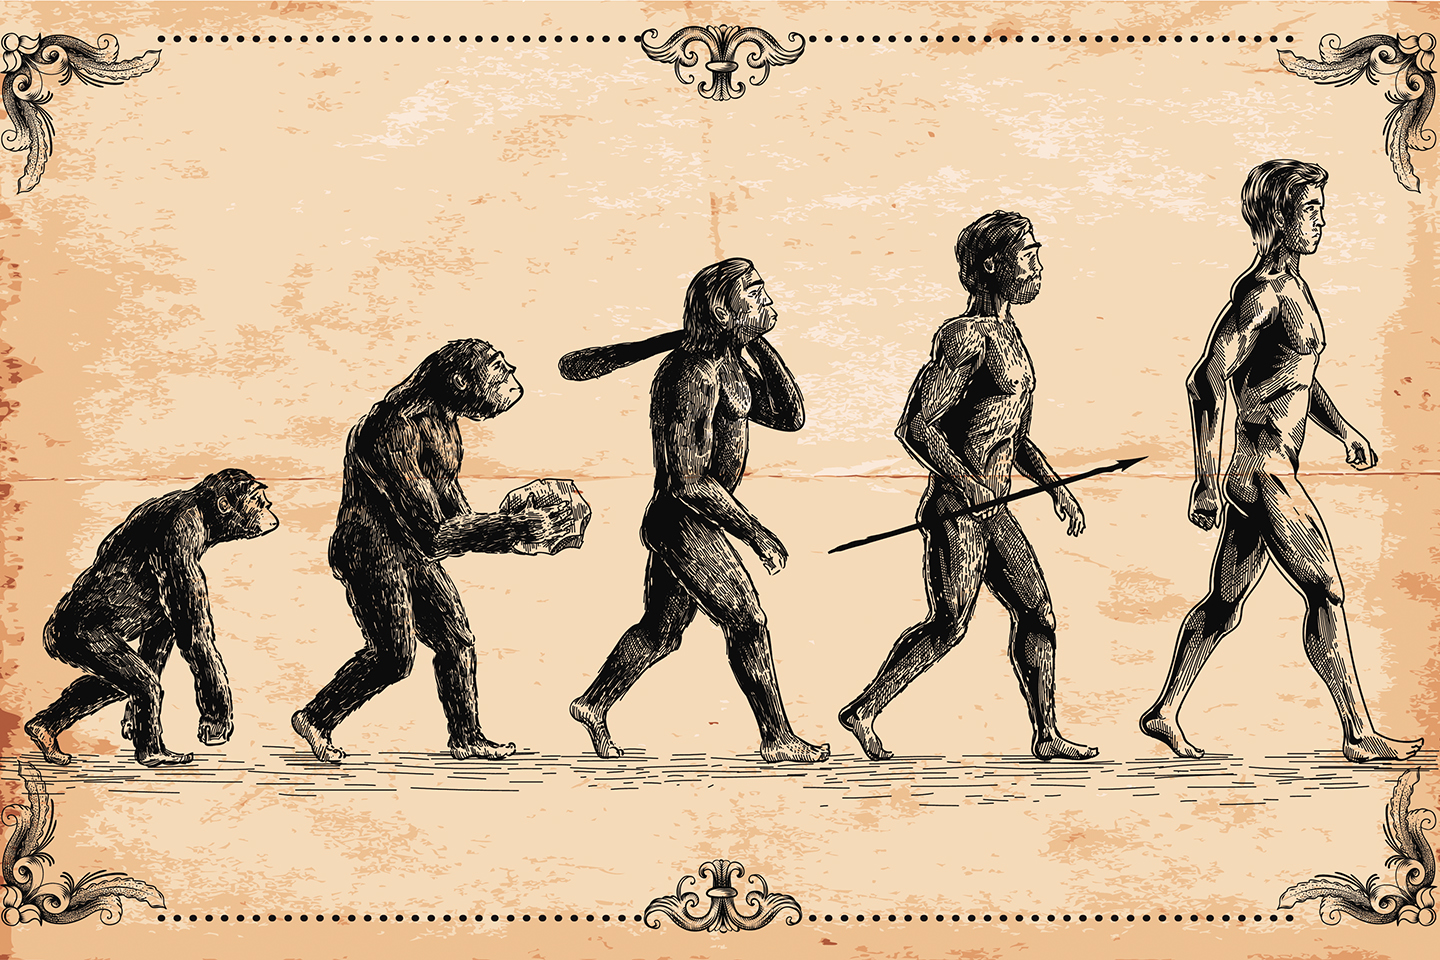
Making, using and refining tools is one of the main elements that constitute the origin of early humans. The first hunting tools made of stones helped our ancestors ascend in the food chain. Fire enabled us to survive extreme climate conditions and to extend our lifetime by making our eating healthier.
It wasn’t just the utilisation of those tools that represented the evolutionary leap towards homo sapiens, though. Actually, other hominids used stone tools even before humans. Some other primates also do.
What is exclusive to humans is our capacity to understand the causal relationship between tools and the result of their use. It’s learning, understanding and transmitting socially our knowledge through generations what makes us unique.
The history of technology starts with those first tool inventions that, because of human understanding, weren’t products of magic to our early ancestors. Today, sometimes we need to remind ourselves that there’s no magic in technology. It’s our capacity to identify and understand causality versus casualty, the science behind the technology, that helps us survive, extend our life expectancy, improve our conditions and thrive in many other ways.
Data-science in Radio as a (non magical) tool
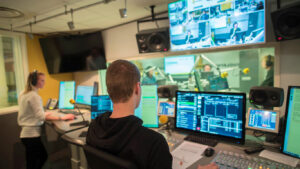
Enough playing anthropologist! I believe I made my starting point. Time to land on our field. Let’s get back to our team’s (Voizzup) point of focus in technology: data analysis at the service of on-air content evaluation in Radio industry.
Guess what, data are not magic either. By just collecting them, we don’t produce an impact. Data analysis tools help us find, observe over time and understand cause-effect relations. Again, it’s the science behind the technology that generates improvement.
By (data) science, we are referring to scientific method: testing causality, documenting results and sharing learning to be challenged in the future. We won’t go very deep into scientific method in this article. Instead, we will tackle the difficulty radio professionals seem to have understanding data analytics as just tools. We intend to describe the different stages we have encountered in the learning curve when using on-air content evaluation tools. From making sense of collected data, to empathetically understanding the psychology behind audience’s listening behaviours.
1. Darkness
Many professionals in the teams we work with have described the time before having analytics for daily on-air content evaluation this way. They rely on gut feeling. They are forced to, given the lack of insights. Frequently, assumptions, inherited absolute truths and undisputed beliefs drive content related decisions. Intuition is a highly valuable skill. However, limiting to intuition as your only prompter when deciding what to bring, keep or remove on-air, is far from ideal.
Example:
Most of the stations we have worked with had strong but wrong assumptions before they started evaluating content with Voizzup.
- “Commercial breaks perform the worst, songs are safe”
- “We are a news&talk station with a focus on business, our listeners are not interested in sports”
- “Playing a brand new song, previously unheard, every day is a strong feature in our programming”
- “Our listeners are tired of this topic, we have been covering it for way too long”
You can be convinced and wrong.
2. Burden
A sudden source of light in the middle of darkness can be blinding, at least for a while. Going from a very silent reality characterised by our intuition, to a noisy new world filled with data points and second-by-second insights is baffling, for everyone. Every new show team we activate, has this initial reaction. The ability to find cause-effect relations between what you do on-air and how listeners respond needs training. People’s first attempts are often hindered by insecurities, fears, and obsessions. Resistance is a natural human reaction when our core beliefs, based solely on intuition or unchallenged conventions, are potentially challenged by data. Our colleague, Tommy, often mentions Star Wars’ Jedi code for explaining this: Fear is the path to the Dark Side. The Force requires discipline and training that never ends.
Example:
It is probably not an exaggeration saying most radio professionals we’ve worked with suspected that daily content evaluation would limit their freedom and creativity. At the same time, the initial impulse for some people when they started using data was to examine (almost torture) themselves. After seeing listeners react second-by-second, they realised the power they had on-air. This made them more responsible (Tommy refers to this as the Spiderman effect) and, paradoxically, also freer.
Once, the host of a music morning show learned of the death of an artist from the local underground music scene when she was on-air. She cried during the show. She deeply regretted it. Until she saw this demonstration of authenticity was the most engaging moment for listeners since we started measuring their reactions.
Relying on impressions that come from fear is not a good idea.
3. Ownership
The first step to overcoming the burden is taking the driving seat, conquering the dashboard and owning the data. They are collected, processed and displayed for you to use. Remember, it is just a tool.
To clarify, this piece of technology won’t replace the team of the radio station making decisions, implementing changes or dictating strategies. Nonetheless, it provides radio professionals with abundant and detailed information for them to answer their questions. The on-air or programming team must formulate questions first and figure out how to prioritise them based on relevance.
Raw data or even processed and beautifully displayed data on a dashboard are not insights. Insights need to be produced from data. By formulating questions beforehand, having a schedule of what we need to evaluate and why, finding patterns with a possible impact that are worth exploring and filtering out non-causal correlations.
Some show teams also start getting rid of their fears at this stage. They begin challenging their core preexisting beliefs, confirming some and denying others. Gaining knowledge in both cases.
Example:
A super popular radio host in his market. He has been directing and hosting this morning show for over ten years. He always based his decisions purely on intuition. It is in his nature; he is a radio beast. From the first day he used Voizzup, he embraced it and, most importantly, owned it. Soon, he began testing new elements for the show and being confident in the results, keeping some and discarding others, after two weeks of testing on-air.
In his words, Voizzup is a “radio-eye opener”.
4. Experimentation
The attitude becomes methodology at this stage. Losing fears and challenging beliefs turns into a systematic process of confirming and rejecting assumptions. That is, the scientific method of experimentation is our new framework.
At this point, the team of the station formulates hypotheses, refutes or validates them through experimentation, defines and manipulates independent variables, measures dependent variables, reach and document their conclusions.
Believe it or not, most of the time, the team avoids using such laboratory terminology or even ignoring the scientific nature of the methodology in the first place.
Example:
Our team, together with the teams at the stations we work with, have conducted tens of experiments in recent years. We made isolated modifications in the on-air content or structure of radio shows and measured whether the impact on Time Spent Listening was positive, in most cases. Some of those manipulated variables were:
- Duration of travel/traffic information.
- Placement of teases.
- Length and structure of contests/games.
- Pushing breaking news notifications.
- Categories of guests for interviews.
Everything you put on-air is being tested. All you need is an extra bit of methodology.
5. Empathy
To understand this stage, two facts of Voizzup’s data-science applied to content in Radio are key:
- Before aggregating events from thousands of listeners, collected raw data consists of individual listeners’ reactions. That allows us to see that “audience” is an artificial concept that over-simplifies the comprehension of listeners’ reactions. The audience doesn’t exist as an entity with an homogenous behaviour. Most of the time, engagement and disengagement are happening simultaneously.
- The high level of granularity in our data allows us to observe extremely clear correlations between content and listeners’ reactions. By displaying these reactions second-by-second, the dashboard reveals changes in the flow of listeners happening very fast as we move from one programming element to another in the on-air content.
As we’ve already seen, at this point the station team has familiarised with the methodology for detecting correlations between on-air elements and listeners’ behaviours that are really causal. This, combined with the two facts just mentioned, triggers a shift in the perception of radio professionals working with Voizzup.
This is the dimension of context, of psychology even. It’s the impressions, the feelings, the motivations behind the listeners’ acts that centres the conversation.
All of a sudden, the thinking and the discussions within the team transcend the dashboard, its indicators and even the mere numeric presentation of data. They reach a higher state of mind-visualisation of listeners’ behaviours.
At this stage, knowing that a programming element triggers tune-outs is not sufficient. We aim at understanding what feelings or emotions were linked to those tune-outs.
Example:
Recently we published a blog post about breaking news push notifications. We showed a graph that displayed the spike in Reach (number of accumulated listeners) generated after a “special coverage” notification was pushed on the mobile apps of a radio station. Generally, we want to make that spike as wide as possible (yes, high as well…) in order to increase listening time. As we explained in the article, often those spikes are very high, but not very wide. For multiple reasons, the listening time of the listeners who tune in triggered by the notification is usually very short.
Precisely those “multiple reasons” are our point of focus in this example. Our most mature customer (more advanced in the learning curve) is at the “Empathy” stage. Concluding that short listening sessions after push notifications are not optimal would probably be correct. That wouldn’t be sufficient learning gained, though.
We are currently working with them in understanding the correlations between the call-to-action (tune-in live now, in the notification) and the listening behaviours. On an almost psychological level. For those listeners who tune-in triggered by the notification on their smartphone, when tuning-out after a few minutes… Is their expectation, their need for an update, satisfied? If that’s the case, the radio station and its mobile app have played their role successfully, happy listener. Or on the contrary, listeners expected more information and didn’t see the value in listening longer? If there’s disappointment behind the tune-outs we are measuring, we’ll likely see a negative impact also in listener loyalty (and even market positioning for the radio brand) in the long run.
Data-science amplifies understanding
We started this article with the video of David Bowie predicting the future of Internet, discussing with Jeremy Paxman whether Internet was just a tool or a revolution. Another viral video might be relevant at the end of this article. Steve Jobs, also in an interview, said: “We, humans, are tool builders. We can fashion tools that amplify these inherent abilities that we have, to spectacular magnitudes.”
Bowie thought Internet was a revolution. For Paxman, Internet was just a tool. Jobs understood that the tools we create and use magnify our abilities which, ultimately, enable transformation. For Steve Jobs, a computer is a bicycle of the mind. For us, data-science in Radio is the bicycle for the understanding of listeners’ behaviours.
Please, get in touch if you think you could use our help riding it!